Another interesting day today. And another experience with SAP NetWeaver Java application server. Our application (Vendavo of course) suffered with intermittent database connection problems in one of the customer environments. Like in many other cases, also in this case Vendavo is deployed to SAP NetWeaver Java stack.
In the application log files we found next exception stack trace from SAP NetWeaver:
Caused by: com.sap.engine.services.dbpool.exceptions.BaseSQLException: ResourceException in method ConnectionFactoryImpl.getConnection(): com.sap.engine.services.connector.exceptions.BaseResourceException: Cannot get connection for 60 seconds. Possible reasons: 1) Connections are cached within SystemThread(can be any server service or any code invoked within SystemThread in the SAP J2EE Engine), 2) The pool size of adapter „productionPool“ is not enough according to the current load of the system or 3) The specified time to wait for connection is not enough according to the pool size and current load of the system. In case 1) the solution is to check for cached connections using the Connector Service list-conns command, in case 2) to increase the size of the pool and in case 3) to increase the time to wait for connection property. In case of application thread, there is an automatic mechanism which detects unclosed connections and unfinished transactions. at com.sap.engine.services.dbpool.cci.ConnectionFactoryImpl.getConnection(ConnectionFactoryImpl.java:59) at com.vendavo.core.omi.JDBCHelper.getConnection(JDBCHelper.java:267) … 36 more
More details about this exception can be found at help.sap.com.
After we verified that Oracle parameters PROCESSES and SESSIONS are set to sufficient values we came to conclusion that problem is in NetWeaver database connection pool, where the limits are hit. And that the most probable cause of the problem is connection leak. Somewhere database connections are not properly closed.
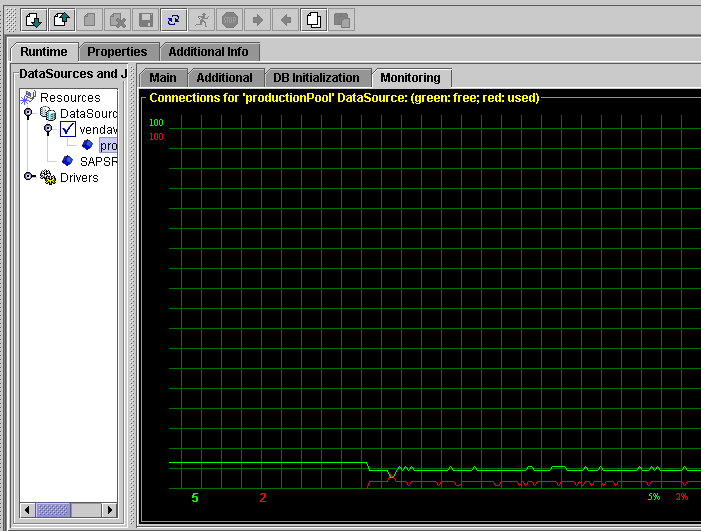
I found that SAP NetWeaver Java App server contains very nice connection pool monitor in its Visual Administrator. Real-time chart displays number of used / free connections in the pool.
We found that after a particular business action is invoked, limit of connections in the pool is hit almost immediately. Next figure shows that pool does not have any more free connections. All 100 connections are used.

We were able to find the code where the connection was not closed properly pretty quickly and the fix was easy. Next picture shows the same bussiness operation after we applied the fix:
I really appreciate the idea having the real-time connection pool monitor in Visual Administrator.
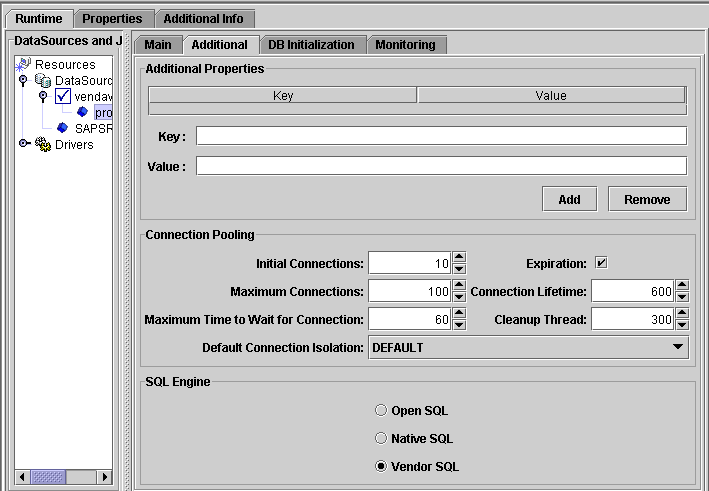
Btw. if you ever wondered where the connection pool is configured (maximum connections, initial connections etc.), it’s in the Additional tab of the given data source in the Visual Administrator:
Visual Administrator / Server / Services / JDBC Connector / Resources / Data Source

A very good job…. but, how did you find the code where the connection was not closed properly?? we are facing the same issue and can't solve it…. i think it is a risk analysis batch job..
To se mi líbíTo se mi líbí
you are the man…
To se mi líbíTo se mi líbí
starting with Netweaver CE, this is not in Admin anymore, integrated in NWA
To se mi líbíTo se mi líbí